Ideal height-weight chart – is it an accurate indicator of good health?
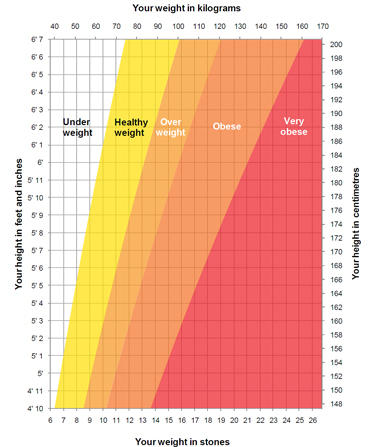 Every time you go to a clinic or a gym; the first thing they do is measure your height and tell you what your ideal weight should be. Now the problem lies in the fact that in India there’s no such thing as an ideal height-weight chart for Indians and a Google search for the same turns up an National Health Services, UK chart. Now according to that chart, a person of my height (5’10’’) would be judged on one of the categories mentioned below:
- Underweight: Less than 65kg
- Healthy Weight: 65kg to 75kg
- Overweight: 75kg to 95kg
- Obese: 95kg to 125kg
- Very Obese: More than 125kg
So according to this chart even a healthy man who works out a lot or has a high bone density and weights above 75kg would be considered overweight.
What you need to realise is that these charts aren’t even designed for Indians (the NHS is based in the UK) and they’re in no way accurate. That’s why there exist other health indicators to see if a person’s healthy or not.
The two most popular ones are body mass index and body fat percentage.
Body Mass Index (BMI)
The BMI is a tried and tested technique to record obesity. It’s calculated by dividing your weight in kg by square of your height in metres. So a person who’s 176 cm and weighs 85 kg will have a BMI of 27 roughly which is considered overweight by WHO standards.
Category
BMI range – kg/m2
BMI Prime
Very severely underweight
less than 15
less than 0.60
Severely underweight
from 15.0 to 16.0
from 0.60 to 0.64
Underweight
from 16.0 to 18.5
from 0.64 to 0.74
Normal (healthy weight)
from 18.5 to 25
from 0.74 to 1.0
Overweight
from 25 to 30
from 1.0 to 1.2
Obese Class I (Moderately obese)
from 30 to 35
from 1.2 to 1.4
Obese Class II (Severely obese)
from 35 to 40
from 1.4 to 1.6
Obese Class III (Very severely obese)
over 40
over 1.6
The BMI has been used by the WHO to calculate obesity statistics and is the go-to inexpensive tool to decide whether someone’s underweight, healthy, overweight or obese. However, the system is still flawed because the BMI doesn’t take into account frame size, muscularity or the proportions of fat you have in the body, etc. Thus the BMI isn’t considered an accurate health indicator for measuring athletes, older people (bone density goes down), children (bone density still increasing), etc. It’s especially wrong for athletes since it considers an athlete who’s fit and has higher muscle weight to be fat!
Body Fat Percentage
The other method is to calculate body fat percentage which is a more accurate method to see how healthy a person is. High body fat percentage indicates obesity (which makes you prone to cancer, diabetes, heart disease and a host of other ailments) while a low body fat percentage isn’t good either because the body needs vital fats to function. There are various different methods to calculate it including – bioelectrical impedance analysis, calliper or a DEXA scan but the latter two can be more expensive and won’t be available in every gym.
What is the ideal body fat percentage?
Men and women both require a different body fat percentage. Also, the ideal body fat percentage changes with age.
For women
- Age 20-40 years – Ideally, the body fat percentage should be between 21-33%. Anything over 39% indicates obesity.
- Age 41-60 years – The ideal range for this age-group is 23-35%. Anything above 40% could indicate obesity.
- Age 61-79 years – People in this age-group should have 25-37% body fat. Above 42% of body fat is a cause for concern as it indicates obesity.
For men
- Age 20-40 years – The healthy range for men men in this group is 8-19%. Anything above 25% indicates obesity.
- Age 41-60 years – Ideally, the body fat percentage for these men should be 11-22%. If it is above 27% then it is a cause for concern.
- Age 61-79 years – Men in this age-group should have 13-25% body fat. If the body fat percentage is above 30% it indicates obesity and is not at all healthy.
So now what you know the different indicators of good health, don’t let the height-weight chart fool you!
Check out our healthy foods section and healthy recipes section for more ideas. Also check out these articles.
- Weight loss diet by expert dietician
- Weight loss diet plan for different calorie needs
- Vegan weight loss diet plan
- 6 home remedies for weight loss
- 10 food items for weight loss
- 7 healthy snacks for weight loss
- 7-day diet for weight loss
- Ayurvedic diet plan for weight loss
- Pre-marriage weight loss diet plan
You could also try out these exercises for specific body parts:
- Exercises for shoulders
- Exercises for abs
- Exercises for arms
- Exercises for legs
For more articles on bodybuilding, check out our bodybuilding section. Follow us on Facebook and Twitter for all the latest updates! For daily free health tips, sign up for our newsletter. And to join discussions on health topics of your choice, visit our forum.
-
Did you know ghee can help you lose weight?
Photo
-
Weight loss Tip 135: Get up from your chair every hour
-
How going vegan helped this 40-year-old woman lose 17 kg!
-
5 reasons you’re not seeing results in the gym
-
How to get rid of your ‘side fat’
-
Keeping the Weight Off
It seems that everyone is concerned with losing weightand fewer people

- DON'T MISS
- Diet Plan and Weight Loss Basics
- How you can help someone lose weight
- Want to lose weight? Time to switch to apple-cinnamon water
- Bollywood glam moms give fitness tips to the new ones
- वज़न घटाने के लिए 12 योगासन
- How to lose weight in 1 month
- Lemon and its health benefits
- Fitness Plan Day 104: Enjoy a vegan day with these healthy and tasty vegan recipes
- 4 must-do exercises for a flat and toned stomach
- How this 115 kg man lost weight will motivate you